Decoding the Influence of User Interface Variations on Submission Success in Virtual Reward Programs
Virtual reward programs operate through digital platforms where participants complete submissions to earn points, entries, or prizes, and user interface design plays a measurable role in determining how often those submissions reach completion. Research from digital engagement studies shows that variations in layout, navigation flow, and interactive elements correlate with differences in submission rates across mobile and desktop environments, with data collected through platform analytics revealing patterns that repeat across multiple programs.
Core Components of Submission Interfaces
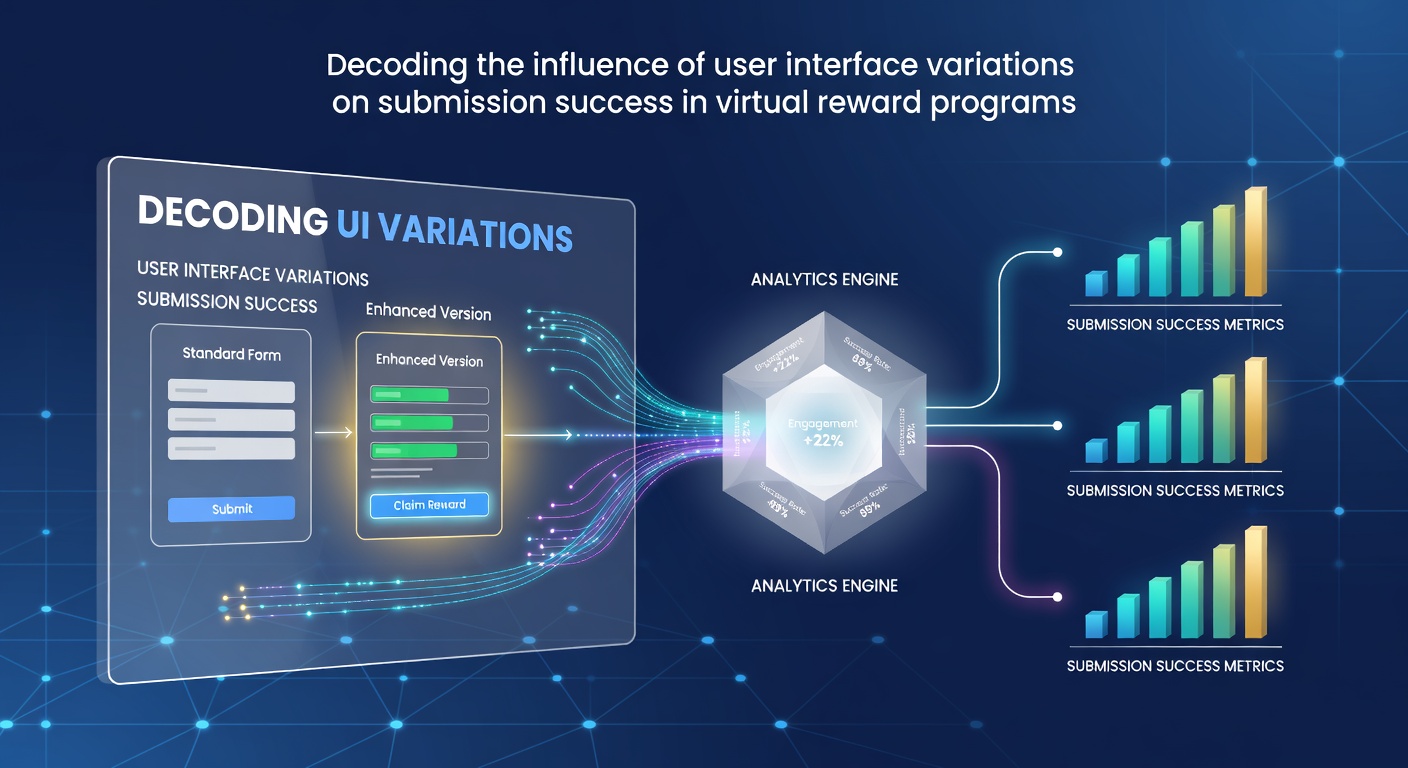
Submission processes typically involve forms for personal details, confirmation buttons, and progress indicators, yet small changes in their arrangement produce measurable shifts in completion metrics. Observers note that programs using single-page layouts with inline validation achieve higher throughput compared to multi-step sequences that require page reloads, according to aggregated platform data from North American and European operators. Those who've examined entry logs find that button size and color contrast influence click-through rates, while placement near the top of the screen reduces scrolling friction for users on smaller devices.
Data Patterns from Platform Analytics
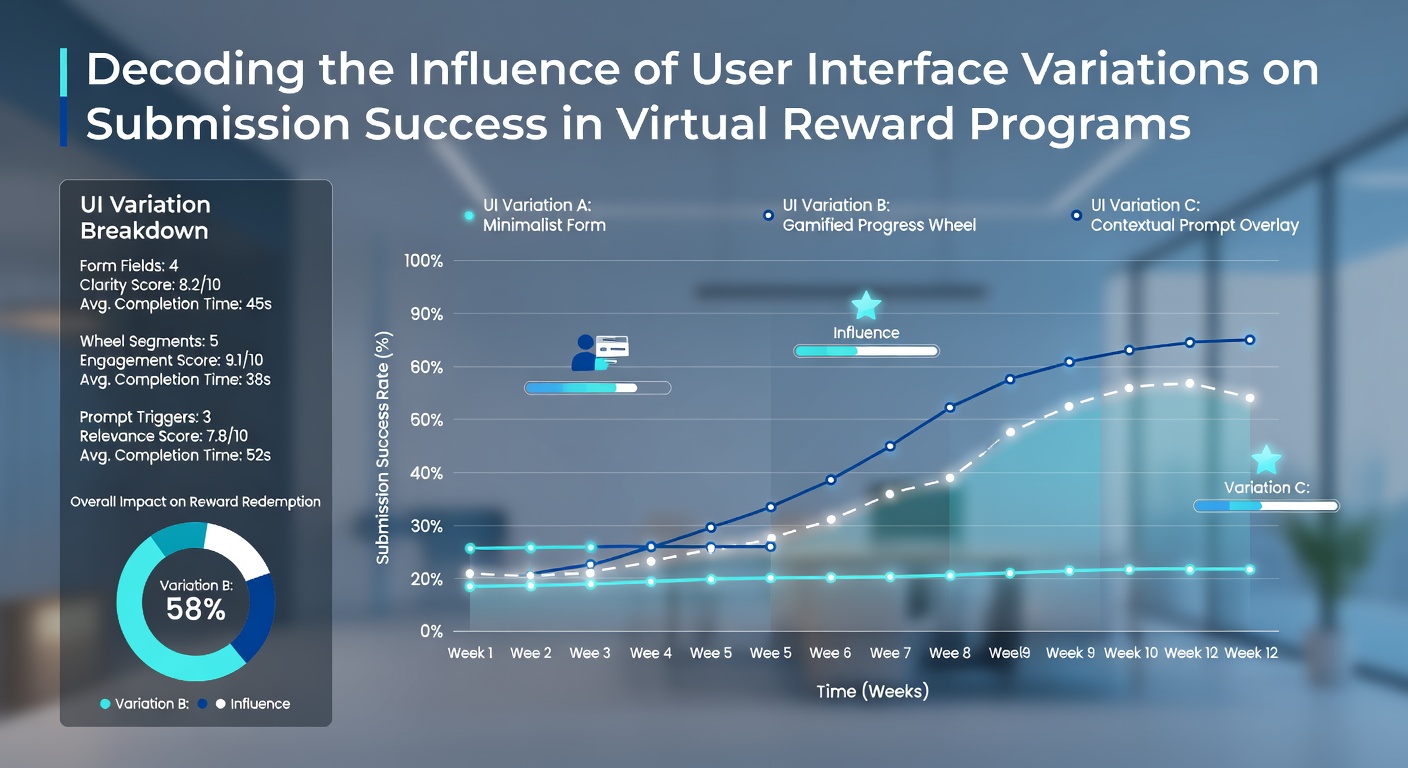
Figures compiled in 2025 across several reward platforms indicate that interfaces incorporating real-time feedback messages see submission success climb by noticeable margins, whereas delayed responses after button clicks correlate with higher abandonment points. Researchers tracking behavior in May 2026 reported that programs integrating progress bars maintained steadier engagement through longer forms, particularly when participants accessed services via tablets rather than smartphones. What's interesting is how these patterns hold across different reward types, from loyalty point accumulation to contest entries, suggesting interface mechanics exert consistent pressure on outcomes independent of the specific prize structure.
Comparative Effects of Design Choices
Studies comparing minimalist versus feature-rich interfaces reveal that added elements like social sharing prompts or optional fields often extend the time users spend before submitting, which in turn lowers overall success percentages. Data from industry reports compiled by organizations such as the Pew Research Center on digital task completion shows that streamlined designs reduce cognitive load, allowing participants to finish processes without backtracking. Meanwhile, interfaces that embed help text directly beside input fields demonstrate lower error rates during validation stages, a finding replicated in testing conducted across Australian and Canadian reward operators.
Yet variations in color schemes and typography also register effects, with high-contrast palettes supporting better readability on outdoor mobile use and thereby sustaining submission momentum. Those monitoring session recordings observe that users encountering mismatched font scaling on certain browsers pause more frequently, creating friction points that accumulate into drop-offs before final confirmation.
Regional and Device-Specific Influences
Platform operators in the European Union have documented how compliance-driven additions such as consent checkboxes alter submission paths, sometimes extending completion times when positioned after primary input sections. In contrast, programs serving Canadian participants show that pre-checked optional fields paired with clear opt-out language maintain higher throughput while meeting regulatory expectations. Device context further modulates these outcomes, with touch-target spacing proving critical on mobile screens where finger precision varies, according to usability metrics gathered by research groups focused on human-computer interaction.
Take one analysis of aggregated logs from multiple programs where desktop users completed submissions at steadier rates when keyboard navigation shortcuts appeared alongside mouse-based options, whereas mobile cohorts benefited more from swipe gestures that advanced through sequential screens without requiring precise taps. These distinctions surface consistently in testing cycles run during early 2026, underscoring how interface adaptations tailored to hardware constraints shape participation volume.
Measurement Approaches and Observed Trends
Analytics frameworks employed by reward program administrators track submission success through funnel visualizations that isolate each interface stage, allowing identification of drop-off clusters tied to specific design features. Reports from academic sources including university-led digital behavior labs indicate that A/B testing of button wording produces repeatable lifts when action-oriented language replaces neutral phrasing, with gains appearing across both new and returning participant cohorts. Observers tracking longitudinal data note that seasonal spikes in engagement, such as those observed around May 2026, amplify the visibility of interface weaknesses because higher traffic volumes expose friction points that remain hidden during lower-activity periods.
Programs incorporating accessibility standards, including screen-reader compatibility and adjustable text sizing, register broader reach without compromising core submission metrics, a pattern verified through compliance audits conducted by international digital standards bodies. Those reviewing cross-platform performance find that responsive designs that adapt fluidly between portrait and landscape orientations sustain momentum better than fixed layouts that force manual zooming.
Conclusion
Interface variations exert measurable influence on submission success within virtual reward programs through their effects on flow, feedback timing, and device adaptation, with quantitative records confirming consistent directional impacts across diverse operational contexts. Continued monitoring of these elements supports refinement of digital environments where participants interact with reward mechanisms, and data gathered through established analytics practices continues to map connections between design decisions and completion outcomes.